Why Inaccurate Industry Filters Waste Your Sales Budget

You look up car dealerships in New York, and somehow the results include auto repair shops, parts stores, and even motorcycle dealers. It might not seem like a big deal, but inaccurate filters waste your time, inflate your outreach costs, and make it harder to connect with real buyers. Below, you’ll see a simple way to measure that drift, show what it really costs in dollars, and fine-tune your filters so you’re only working with the industry you actually asked for.
TL;DR
-
Industry drift happens when your search quietly expands beyond what you actually want. You might look for car dealerships but end up with repair shops, parts stores, or motorcycle dealers mixed in.
-
It seems harmless, but it makes your list bigger without making it better. You spend more time and money reaching out to people who aren’t really a fit, and your results start to slip.
What is Industry Drift?
You choose a specific industry, but your data platform or lead tool automatically expands it to include related categories. Drift usually happens because of:
-
Keyword lookalikes: “car dealership” also matches with “auto service” or “auto repair shops.”
-
Category spillover: related subcategories get included even though you didn’t choose them.
-
Similar or related expansions: broad semantic matches that end up going too far, like when a search for car dealerships also brings up auto lenders or car rental companies.
In the end you get a bigger list, but fewer qualified prospects.
How to Measure Industry Drift and Check Your Data Accuracy
Take a random sample from your B2B contact list or lead database, around 200 companies is usually enough, and then label each row:
-
Exact: this is the actual industry you asked for.
-
Near: similar industry you didn’t ask for, like parts, motorcycle, or service businesses.
-
Off: clearly not the industry you asked for.
Now calculate two simple stats:
-
Contamination (c) = (Near + Off) / sample size
-
Precision = Exact / sample size
For example, if your sample size is 200 and you have 150 marked as Exact, 25 as Near, and 25 as Off, then:
-
Contamination (c) = (25 + 25) / 200 = 1/4 = 25%
-
Precision = 150 / 200 = 3/4 = 75%
This gives you a clear metric to measure data accuracy and see exactly how much of your lead list is off-target. Let’s go through an example that converts that drift to dollars.
How to Calculate the Real Cost of Industry Drift
Let’s start by defining a few inputs:
-
N = the number of contacts you ordered.
-
c = the contamination rate in your list (see formula above).
-
m_e = the average meeting rate you get from Exact contacts. A meeting means a prospect responded to your outreach and booked a scheduled call or demo to learn more. To calculate your meeting rate, divide the number of contacts who booked a meeting by the total number of contacts you reached out to.
-
m_c = the average meeting rate you get from contaminated contacts (Near + Off)
-
close = your typical close rate from meetings. Your close rate is the percentage of meetings that turn into paying customers or completed sales.
-
ASP = your average sale price after a purchase.
The two equations to use:
-
Lost meetings = N * c * (m_e - m_c)
-
Lost revenue = Lost meetings * close * ASP
That’s it! You’ve turned an annoying data problem into a measurable business metric.
Example: Measuring Lost Revenue from Industry Drift
Let’s say you asked for “Car Dealerships in New York.” and your list has the following: You have 500 contacts:
-
365 were Exact
-
85 were Near
-
50 were Off
Using the Contamination equation we mentioned earlier, this gives you a contamination rate of 27%.
Now plug these into the formulas using sample values to estimate how much bad data costs your pipeline:
-
N = 500
-
m_e = 1.5%
-
m_c = 0.2%
-
close = 20%
-
ASP = $1,000
Results:
-
Extrapolated contaminated contacts: 500×0.27=135
-
Lost meetings: 500×0.27×(0.015−0.002)≈2
-
Lost revenue: 2×0.20×$1,000=$400
-
Total impact: $400
And that’s just from one list.
Why “Similar” or Near Industries Can Quietly Hurt Your Sales Results
Sometimes you want a wide reach, and that’s fair. But for focused outbound, being “Near” usually means this:
-
Wasted timing: the conversation, the problems, and the concerns don’t really match up because you’re reaching out about something they don’t actually need. It feels off, like you’re trying to solve a problem that isn’t theirs.
-
Lower engagement: what you’re saying isn’t really relevant, so you get fewer opens and replies, and over time that starts to hurt your sender reputation.
-
Pipeline slowdown: a small drop in meeting rates across many contacts adds up quickly and can drag down your entire sales process.
If you’re reaching out to nearby industries on purpose, that’s fine, just make sure you understand the trade-off and factor it in. But if it’s happening by accident, that’s something you need to fix as soon as possible.
How to Improve Your List Accuracy Without Making It Complicated
Whether you’re building a list yourself or getting one from a provider, accuracy comes down to a few simple habits.
-
Be clear about what industry/ies you want included.
Write one short sentence that describes exactly who you’re trying to reach.
For example: Only businesses that sell new or used cars directly to consumers. -
List what should not be included:
Add a couple short exclusions so your provider knows the boundaries.
For example: Exclude auto repair, body shops, and parts distributors. -
Check a small preview sample. Most providers let you review 10 to 20 contacts before you buy. Mark each one as Exact, Near, or Off so you can see how accurate the list is. If you want the highest accuracy, choose human-verified lists over lists that rely only on software filters.
-
Tweak your inputs before purchasing more:
If more than one or two in the sample list don’t fit, go back and clear up your request or narrow your filters before you pay for the full list. -
Set your own quality bar.
For focused outreach, try to keep less than 5 percent of your data off target. If you’re going after a wider audience, a bit more is fine, as long as you know what you’re trading off.
Once your filters are clear and you know exactly what counts as Exact, it’s worth finding out how much that level of precision is really worth. Even a little drift can increase your cost per meeting, sometimes faster than you’d think. Let’s look at why that happens and what the curve looks like when your budget stays the same but your list starts becoming off target.
How Industry Drift Increases Your Cost per Meeting
Here’s how drift increases your cost per meeting:
-
Say you spend a fixed budget on a batch of B2B contacts. Each batch has 1,000 contacts.
-
When the list starts drifting, less of those contacts become a real fit.
-
Fewer good-fit contacts means fewer meetings.
-
You’re spending the same amount, but getting fewer meetings, which means your cost per meeting goes up.
That last step is what makes costs rise faster. As drift grows, fewer qualified leads turn into meetings, and your cost per meeting rises faster than you expect.
Drift vs. Cost per Meeting
This chart shows how cost per meeting rises as contamination increases. The shaded area represents a realistic range of meeting rates, since different teams see different results.
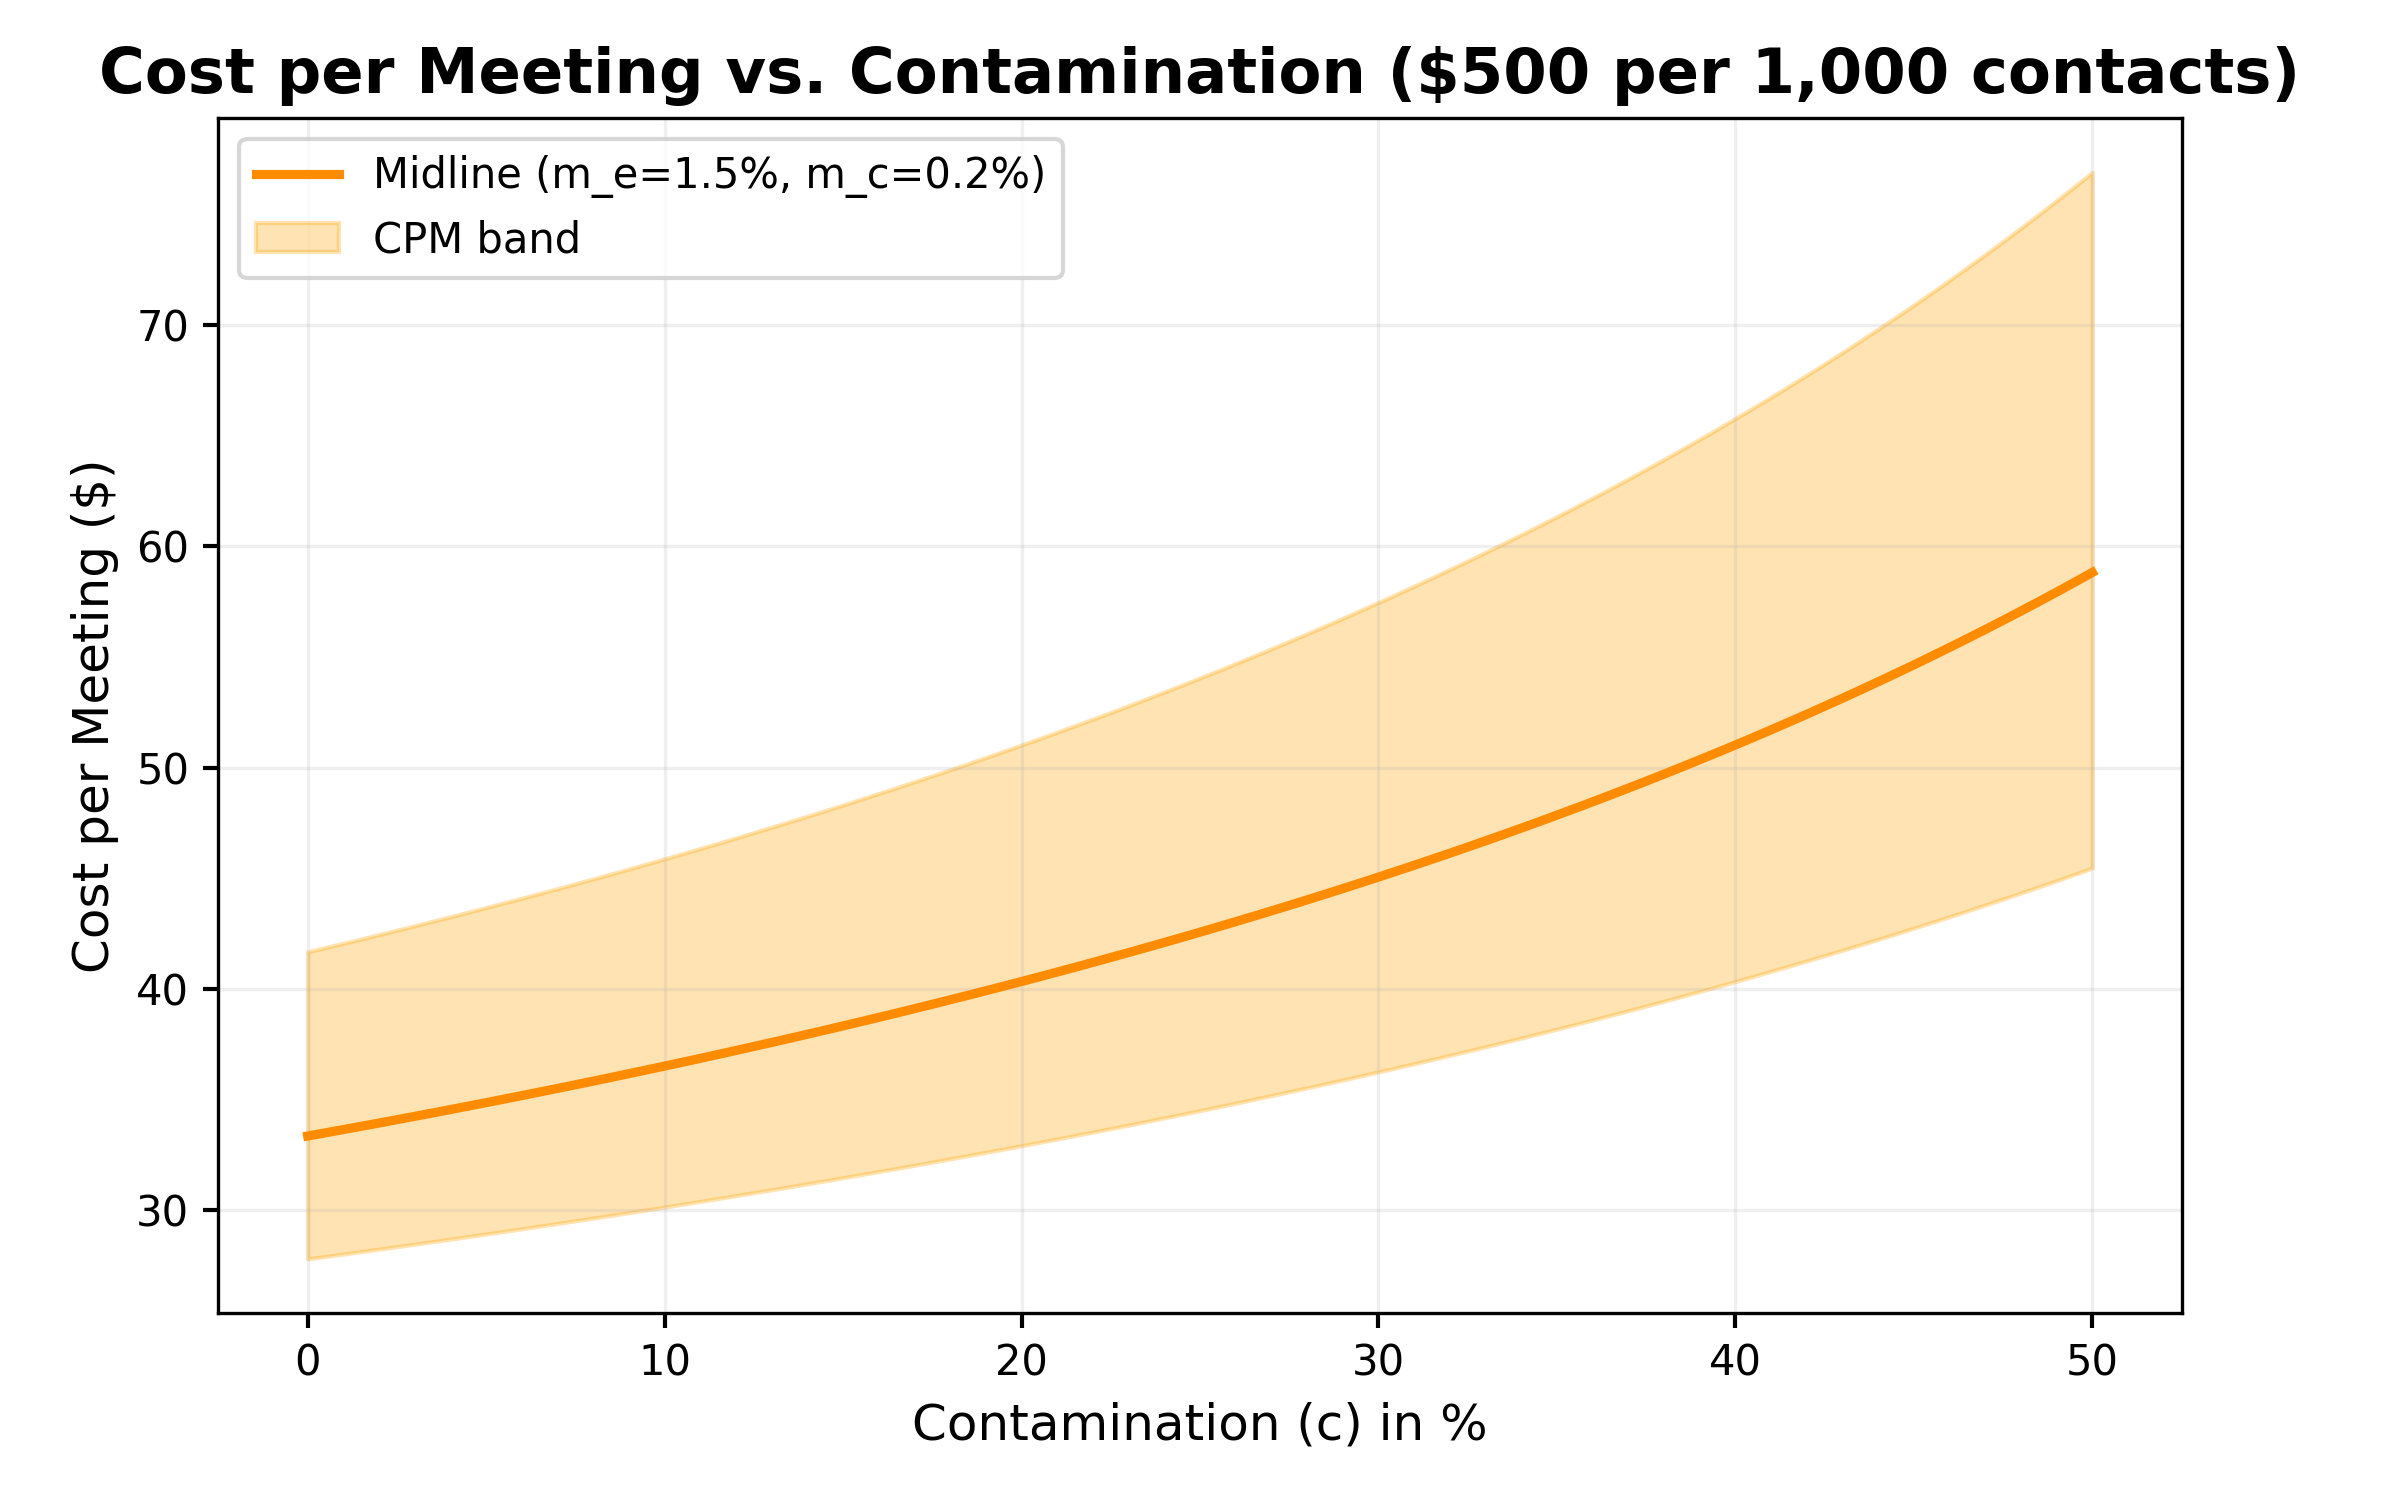
How to interpret the chart:
-
On the left side, where drift is low, you get more meetings from the same batch of contacts, so each meeting costs less.
-
As you move to the right and drift increases, you get fewer meetings for the same spend, so each meeting costs more. The curve starts to bend upward instead of staying straight, which is why drift ends up hurting more than it seems at first.
Here is the equation behind the chart:
Cost Per Meeting =
With example numbers:
Let’s say you spend $500 for every 1,000 contacts, and your data usually performs like this:
-
Exact contacts: around 1.5% turn into meetings
-
Contaminated contacts: around 0.2% turn into meetings
Then:
-
0% drift gives you 15 meetings, which works out to roughly $33 per meeting.
-
20% drift drops you to 12.4 meetings, or around $40 per meeting.
-
40% drift leaves you with about 9.8 meetings, which means each one costs about $51.
At the end of the day, you spend the same amount and get fewer meetings. And even worse, your cost per meeting can climb very quickly.
Bottom line: Why List Accuracy Beats List Size
Lists that look big but aren’t accurate almost always cost you more in the long run. Take 200 rows, label them, and calculate your contamination rate to see how accurate your data really is. If it is, great. If it’s not, make your filters more accurate and use it towards your advantage.
FAQ
How do I know if my B2B list actually has drift?
Take a quick look at a small sample of your list, 10-20 usually works well, and tag each row as either Exact, Near, or Off. If even one or two are clearly outside your target industry, then that means that there's probably more in the entire list.
Is a small contamination rate really that bad?
It can add up fast. Even a small number of off-target contacts can drag down your meeting rate and quietly push up your cost per meeting. The more drift you have, the quicker those costs climb. That’s why it’s worth keeping drift under about 5% if you care about your ROI and sender reputation.
What’s the best way to prevent drift when ordering lists?
Start by being specific with the industry you want. Describe your ideal industry in one clear sentence, then add a few examples of what you don’t want included. Always ask for a sample before you buy so you can double-check that the data actually matches what you need. If you’re working with a provider, find out how they verify industry classifications and whether they do any sampling for accuracy before they send the full list.
Ready to reach fresh, human-verified leads today?
Start for FreeRelated articles

12 Best Places to Find High Quality B2B Leads
Discover 12 proven places sales teams find high quality B2B leads using customer research, LinkedIn, buying signals, and verified contact data.

B2B Data Decay by Industry
Learn how B2B data decay impacts CRM accuracy by industry with benchmarks, warning signs, and tactics to improve pipeline coverage and conversion.

Why Nobody Answers Your Sales Calls
If your outbound calls aren’t getting answered, it’s often because the number isn’t usable, your calls are being labeled as spam, or the call feels unfamiliar and low priority. This guide shows how to identify which it is and what to fix first.